RSI Breakout
RSI Breakout catches the moment a stock's momentum flips back into positive territory. It uses a different tool than the relative strength scanners, and the distinction matters. This chapter starts from scratch on RSI, then explains the exact signal.
First, what RSI is
RSI stands for Relative Strength Index. Despite the similar name, it has nothing to do with the relative strength rating used elsewhere in the platform.
RSI is a momentum oscillator. It is a number between 0 and 100, calculated from the stock's own up days versus its own down days over a lookback period, usually 14 days. It measures internal momentum, not performance against the market.
- When a stock has more and bigger up days than down days, RSI rises toward 100.
- When it has more and bigger down days, RSI falls toward 0.
- A reading of 50 means balanced momentum. Above 50 is positive momentum. Below 50 is negative momentum.
This is the tool this scanner uses. Keep it separate in your head from relative strength, which ranks a stock against the market.
What the scanner does
RSI Breakout flags stocks whose momentum has turned from neutral or weak back into positive territory. It is a momentum-flip signal.
The exact rule
A stock qualifies when:
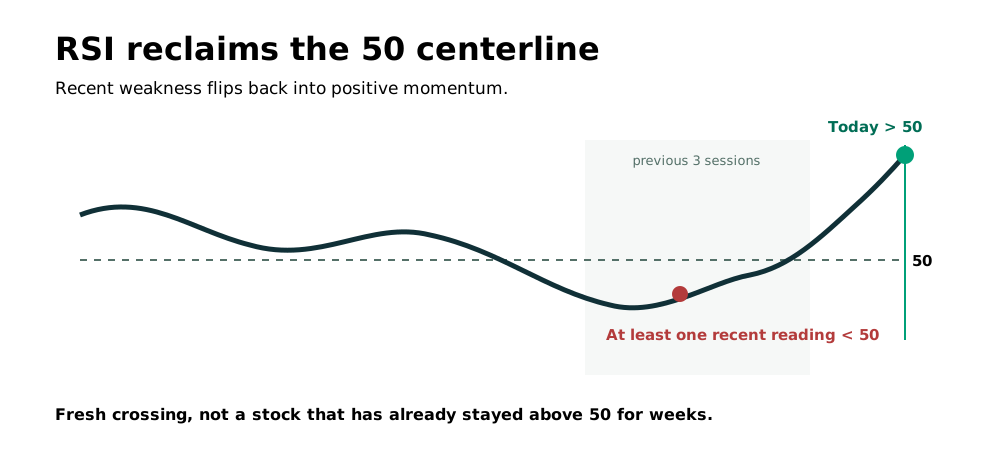
- Its 14-day RSI is now above 50.
- It was below 50 within the last three sessions.
The threshold of 50 is the momentum centerline. Above it, the stock's internal momentum is positive. The scanner wants the day RSI crosses back above 50 after having been below it recently.
The "was below it in the last 3 sessions" part is the freshness. It is not looking for a stock that has been above 50 for months. It is looking for a fresh flip, momentum turning up now.
Why the centerline matters
The 50 line is the divide between positive and negative momentum in a stock's own price action. A stock crossing back above 50 is telling you its up days are starting to outweigh its down days again.
This is often the first sign of a turn. Momentum flips before the trend does. A stock whose RSI is climbing back above 50 is building internal strength, even before the chart shows a clean breakout.
Reading it with other signals
RSI is a momentum indicator, and momentum signals work best in combination:
- An RSI breakout on a stock already in a Stage 2 uptrend is a strong confirmation. The trend and the momentum agree.
- An RSI breakout on a stock still in a decline is often just a bounce. Wait for the stage to turn.
- A stock whose RSI has been above 50 and is rising while the price makes higher highs is in a clean momentum uptrend.
Use RSI Breakout as one lens. Combine it with the stage and relative strength to decide whether the momentum flip is happening in a stock worth acting on.
Why it matters
Momentum is a real force. Stocks with positive momentum tend to keep it, because the buying that created it continues. RSI Breakout catches the entry into positive momentum at the moment it happens.
It is also one of the earlier signals. Momentum often turns before price breaks out, which is why this scanner can put you on a name before the more obvious breakout confirms. This is the intent: catch the momentum flip early, then confirm with the trend.
Where it fits
RSI Breakout contributes to Most Scan Matched as one of the momentum signals. It is a different flavor from relative strength. Relative strength measures against the market. RSI measures the stock's own internal momentum. Both are useful, and a stock showing strength on both is a stronger setup.
Related chapters
- Basics: Relative Strength (to tell the two apart)
- RS Crossing 80
- Stage 2 Breakout