Minervini VCP
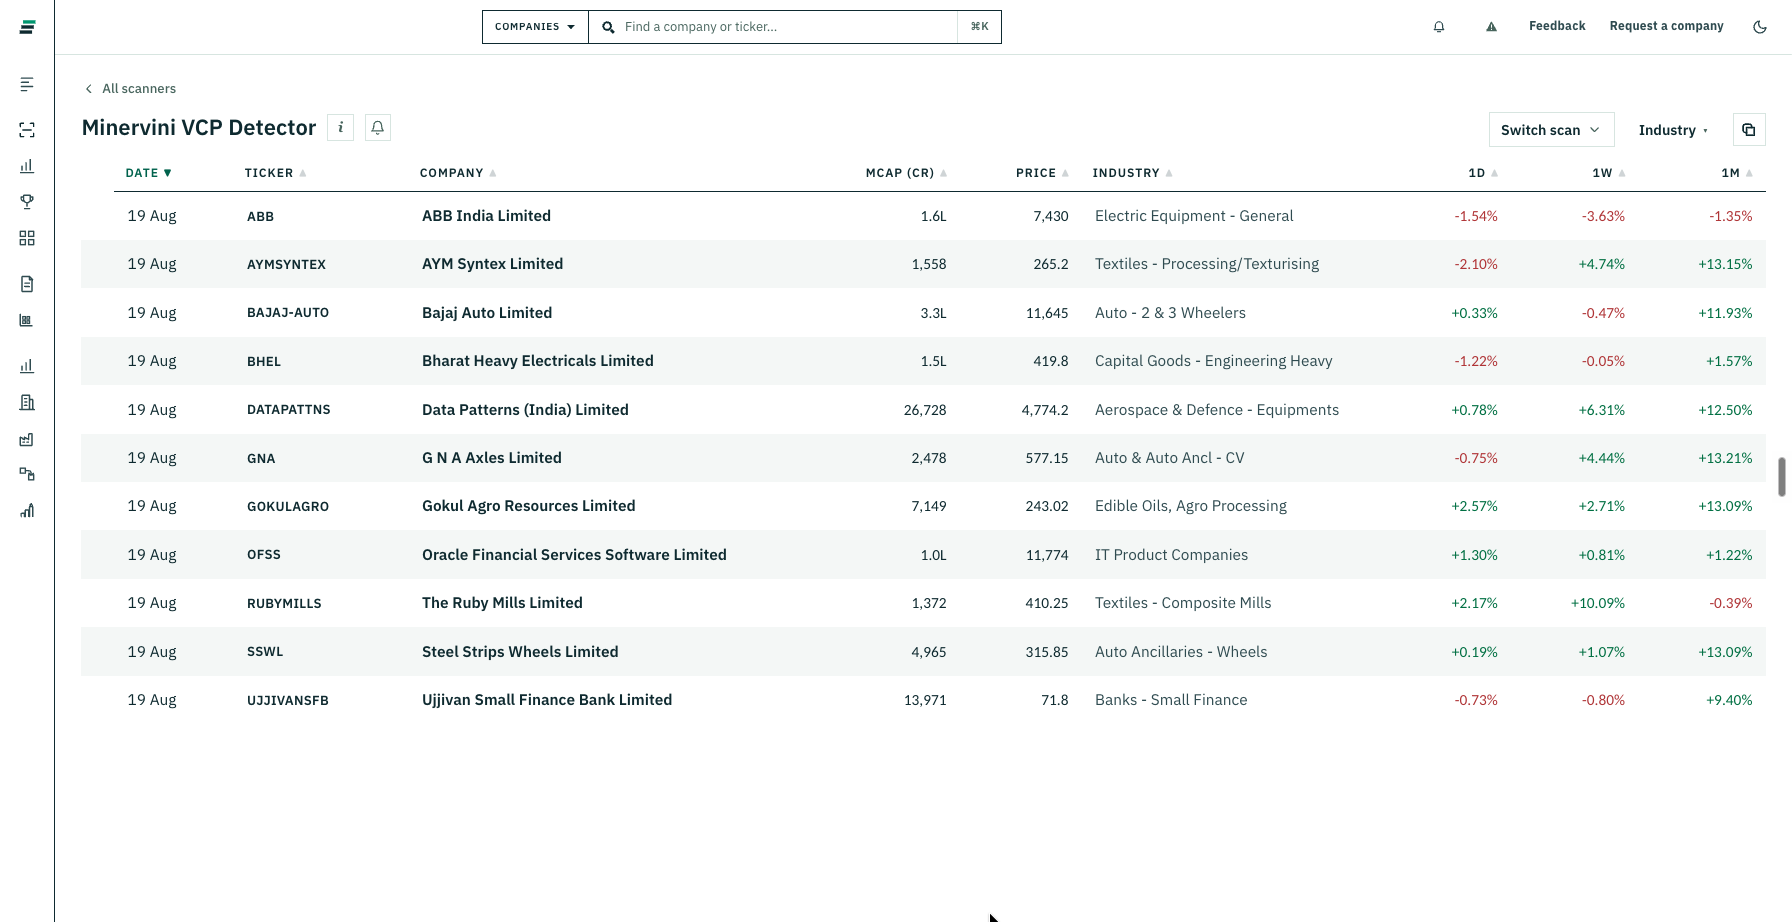
Minervini VCP is the trend template taken one step further. It takes the stocks already passing all ten conditions of Minervini's trend template and asks one more question: is this stock tightening into a low volume base? The answer identifies the leaders that are coiling right before a potential move.
First, what VCP means
VCP stands for Volatility Contraction Pattern. It is a concept Mark Minervini uses to describe how leading stocks pause before they advance.
Think about a stock that has been rising. Before the next leg up, it often pulls back and tightens. The pullbacks get smaller. The ranges get narrower. The volume gets quieter. The stock is coiling, storing energy for the next move.
A VCP is that tightening shape. Picture the price action making smaller and smaller swings, and volume steadily drying up. The stock is being collected quietly, with no panic and no excess, right at the edge of a move.
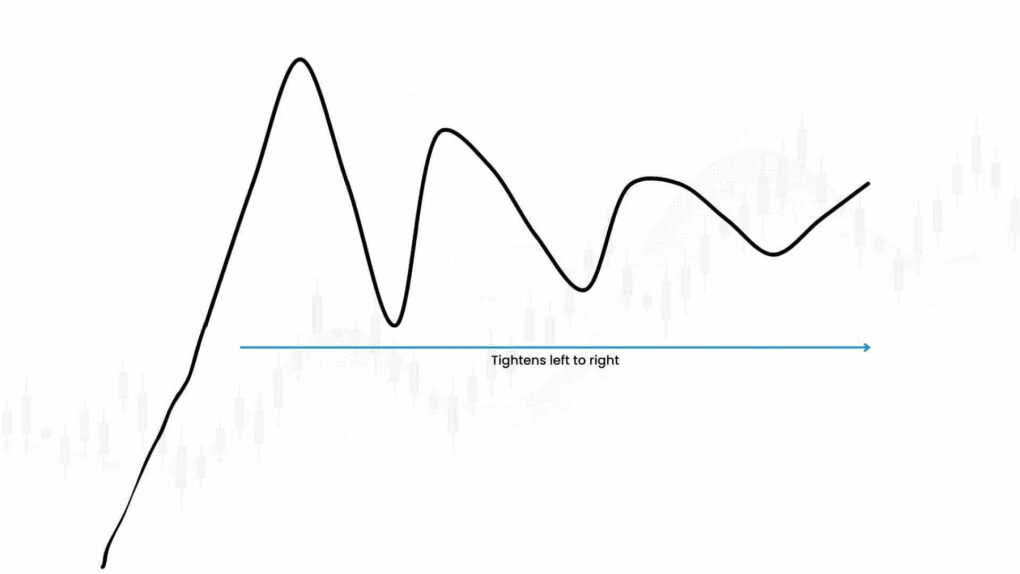
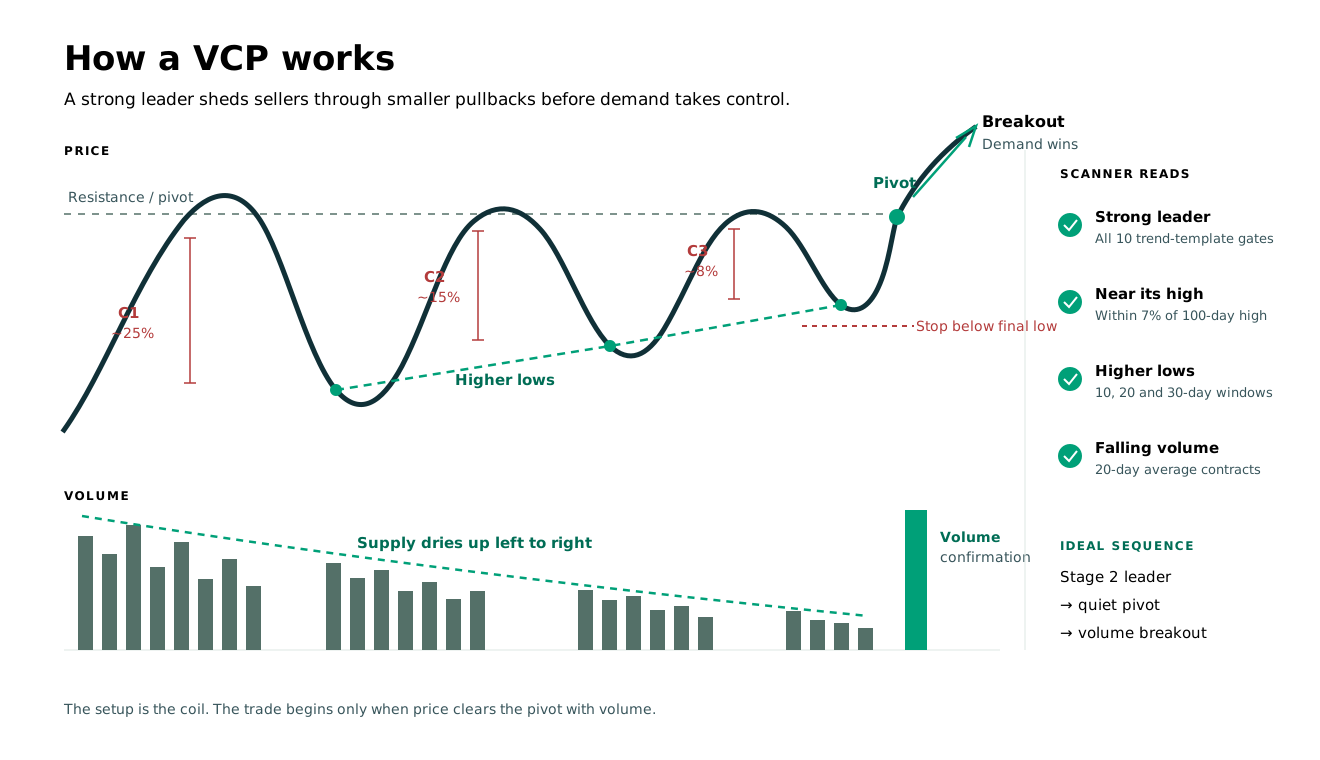
The shrinking is the point. A stock does not pull back the same amount each time. It pulls back less. The first dip might be 25%, the next 15%, the last one maybe 8%. Each pullback tells the same story: fewer sellers are willing to give ground. Supply is drying up, and the path ahead clears.
Why contraction matters
The contraction is the tell of accumulation. When a strong stock pulls back on shrinking volume and then makes progressively higher lows, it is not being sold. It is being accumulated. Sellers are exhausted, and the buyers are quietly absorbing supply without pushing the price around.
The opposite, a wide, wild, high-volume pullback, is distribution. That is a stock being sold into strength, and it is a warning. The VCP scanner exists to separate the quiet, healthy tightening from the noisy, unhealthy churn.
The exact rule
A stock qualifies when it passes all ten conditions of Minervini's trend template, and then also meets the VCP conditions:
It is near resistance. The stock is within about 7% of its 100-day high, and its 100-day high has held steady for about 10 days. It is pressing against the top of its range.
It is near its weekly range high. The stock is within about 20% of its 100-week high. It is in the upper part of its long-term range.
It is printing higher lows. The low of the last 10 days is higher than the low of the 10 days before. The same holds for the 20-day and 30-day lookbacks. The stock is making progressively higher lows, the signature of a tightening base.
Volume is contracting. Its 20-day average volume is lower than it was 5, 10, 15, 20, 25, or 30 days ago. Volume is drying up as the stock tightens.
In plain words: a strong leader, near its high, making higher lows on falling volume. That is the ideal VCP coil.
The higher-lows detail
The higher-lows requirement is the structural core of the VCP. It is the pattern inside the pattern.
Each pullback stops at a higher level than the last one. The lows lift. That is buyers stepping in at higher and higher prices, refusing to let the stock fall. Combine lifting lows with shrinking volume and you have a stock being silently accumulated. The VCP scanner reads both the structure of the lows and the volume trend.
This is a state scan. A stock stays on the list while it keeps meeting the conditions. The value is in finding the leaders at the point of maximum coiling, before the breakout confirms.
What a good VCP looks like
A clean VCP takes time. The best ones form over 6 to 12 weeks, with a firm base of 3 to 4 price contractions. Fewer than three contractions often means the base does not have enough backing. Too many, or a base that drags on too long, can mean the pattern is losing energy.
The quiet point is the tell. Toward the end of a good pattern, the stock settles into a very tight range with minimal day-to-day movement, and volume is at its lowest. That is the pivot, the moment of least resistance. The tighter it gets, the more pent-up the next move.
A classic VCP carries 2 to 6 contractions in total, each smaller than the last. That steady tightening, not a single dip, is what separates a genuine VCP from a stock that just fell once and stalled.
The psychology
The tighter the pattern gets, the more the crowd wants in. That is the engine behind a VCP.
At the start, sellers are in control, and pullbacks are sharp. Then smart money begins accumulating quietly. Each dip holds a little higher, and the few sellers who are left start holding out for better prices. Fear fades. Every smaller pullback tells the onlookers that the stock is being bought underneath, and more buyers edge in.
The pattern becomes a pressure cooker. Each contraction tightens the spring further. By the time the stock reaches the pivot, everyone watching knows it is coiled, and anticipation is high. A single volume surge is enough to release it, and sideline watchers pile in at once, driving the upfront move. That is why the breakout, when it comes, is often sharp and fast.
The trade
The VCP is built for a good risk to reward. You get in near the pivot, with a stop just below the last low. Because the base is so tight, the stop is close, often limiting risk to a small percentage, while the target on a breakaway move is far larger.
This is why the pattern shows up again and again in the biggest winners. A large share of the stocks that eventually gain 100% or more in a year carry a VCP in their base before they run. The setup is the resting point where a strong leader, already in an uptrend, gathers itself before the next leg. It is a continuation pattern, not a bottom. There is no VCP in a stock that is not already in a confirmed Stage 2.
How reliable is it
The VCP is one of the better-documented setups in technical analysis. Mark Minervini's own tracking, and the traders who study his method, point to a consistent pattern: a large majority of VCP breakouts that come on strong volume go on to solid rallies, while breakouts without conviction tend to fail.
Two volume details are worth knowing. A strong VCP breakout often arrives with a 30-40% jump in volume on the breakout day, the institutional sign-off that makes the move real. And breakouts confirmed by that kind of buying have shown the ability to run 20-100% over the following months.
The honest framing: the VCP is a high-probability setup in strong markets, when a stock is already leading and the breakout comes with volume. It is not a guarantee, and it is weakest in falling or choppy markets. The scanner finds the candidates. The volume and the context decide which ones deliver.
Why it matters
Minervini's whole edge is buying the strongest stocks at the right moment in their pause. The trend template finds the strongest. The VCP finds the pause.
A leading stock, in a clean uptrend, near its high, making higher lows on falling volume, is the closest thing to the ideal entry point in trend investing. You are positioned in a proven leader at the moment accumulated selling has dried up.
Reading it with the breakout
A VCP setup is not a completed move. It is a coiled spring. The actual entry comes when the stock breaks out of the base on a surge of volume.
That volume surge is the confirmation. The pivot had minimal volume, the quiet before the move. When the stock breaks above it on a jump in buying, demand has clearly overtaken supply, and the pent-up pressure releases. A VCP breakout without the volume is weaker. The volume is what tells you real buying, not a low-volume drift, is pushing it through.
Use the VCP scanner to build your watchlist of coiled leaders, then watch for the breakout to confirm. The VCP and the breakout are two halves. The scanner finds the setup. The breakout on volume is the green light.