Potential J-Curve Setups
Potential J-Curve Setups is InvestorStack's own scanner, and the deepest thing we have built. Every other scanner reads price or reads one number. This one reads our research. It takes everything we have already written about a company, reads it end to end, and works out one thing: is this business about to start earning a lot more money, for a reason you can already see?
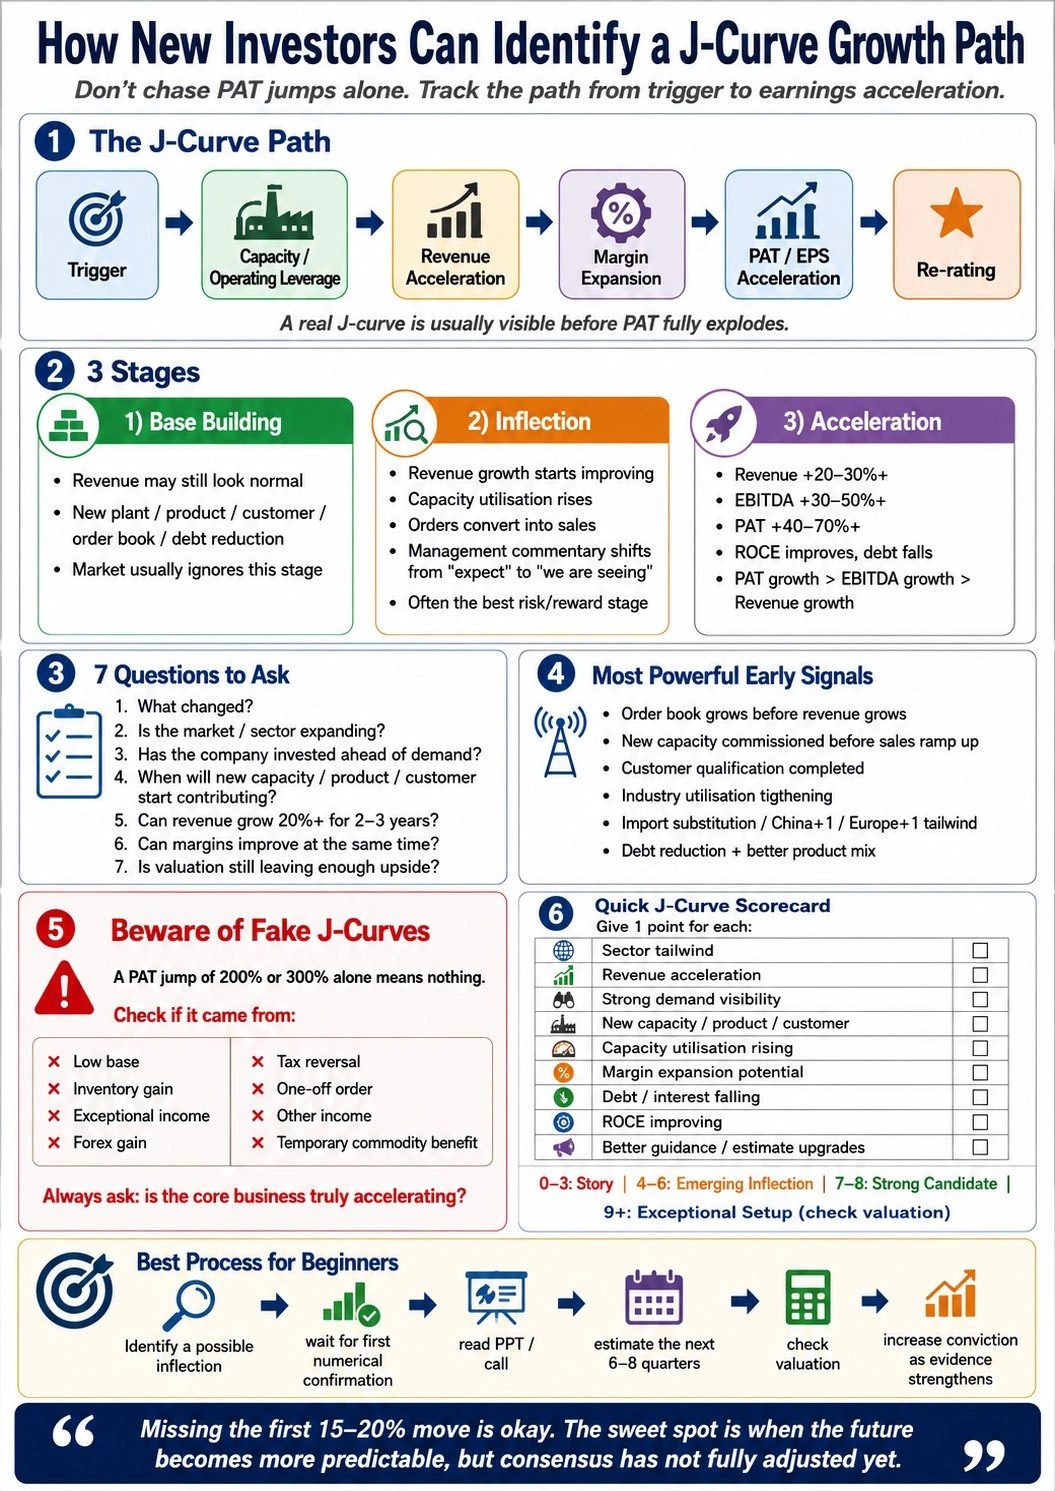
Source: @SureshKBN
This is one of the best scans I have ever used. I might be biased, but you will find a lot of interesting ideas in here. Very proud we shipped this one. This is not a static list. Names will enter and leave as their scores change.
The one idea
Draw the letter J on a piece of paper. It sits flat for a while, then it turns a corner and shoots upward. That is the shape we are hunting.
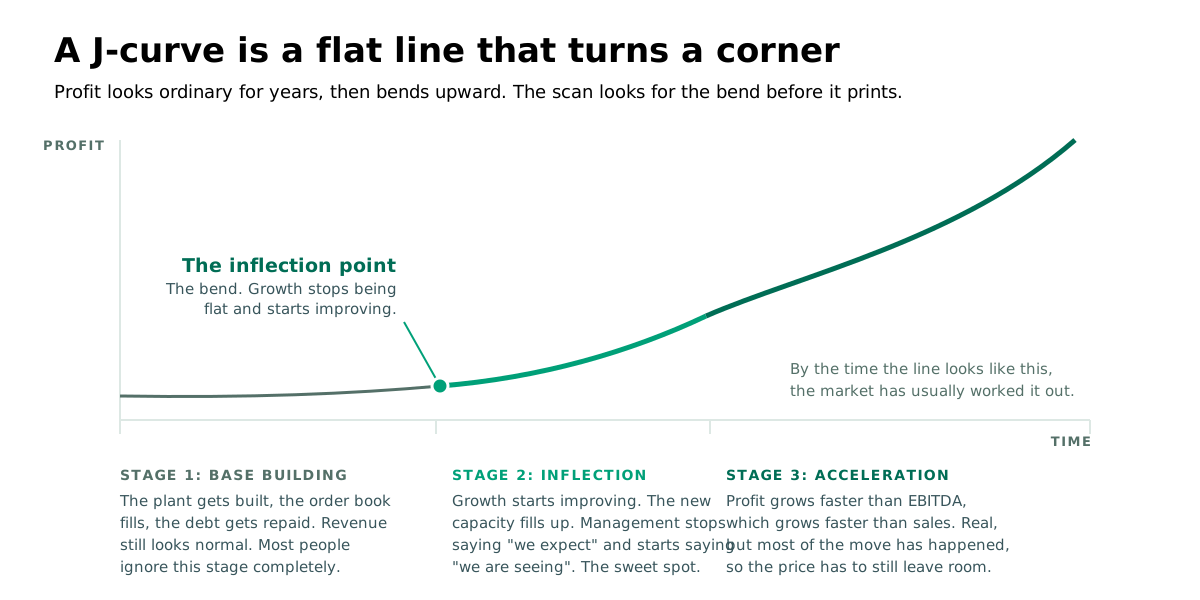
Think about a real business. A company decides to build a second factory. It spends two years and a lot of money building it. During those two years the profit does not go up. If anything it goes down, because the company is spending. The chart is flat. Nobody is interested.
Then the factory opens. It starts making things. It starts selling them. Suddenly the same company, with the same staff and the same customers, is earning far more than it was, and the cost of running it barely moved. The line turns the corner.
The flat part is boring and nobody watches it. The steep part is exciting and everybody watches it. The money is made by the people who were already there during the boring part.
What "inflection" means
You will see the word inflection everywhere in this scan, so it is worth ten seconds.
An inflection point is simply the place where the line stops being flat and starts going up. The bend. The corner of the J.
That is it. There is no more to it than that. When we say a company is "at an inflection", we mean the boring flat part looks like it is ending and the climbing part looks like it is starting.
Why we care so much about the bend: everything before it is cheap to buy because it looks boring, and everything after it is expensive to buy because it looks obvious. The bend is the only place where you can see what is coming and still be early.
What makes it real
Here is the part that matters most, and the part most people get wrong.
A company reporting that its profit tripled is not automatically a J-curve. Profit can triple for boring, temporary, meaningless reasons. It can triple because last year was terrible. It can triple because the company sold a building. It can triple because a tax refund landed.
For it to be a real J-curve, the extra profit has to come from something physical that actually happened, and that you can put a date on:
- A new factory got switched on.
- An order book got filled.
- A big customer approved the product after two years of testing.
- Prices went up and stayed up.
- A pile of debt got paid off, so the interest bill shrank.
Something real, that happened, on a date. If nobody can point to the thing that changed, there is no J-curve, no matter how good the numbers look.
The path: six steps, always in order
A J-curve does not appear from nowhere. It walks through the same six steps every single time, in the same order.
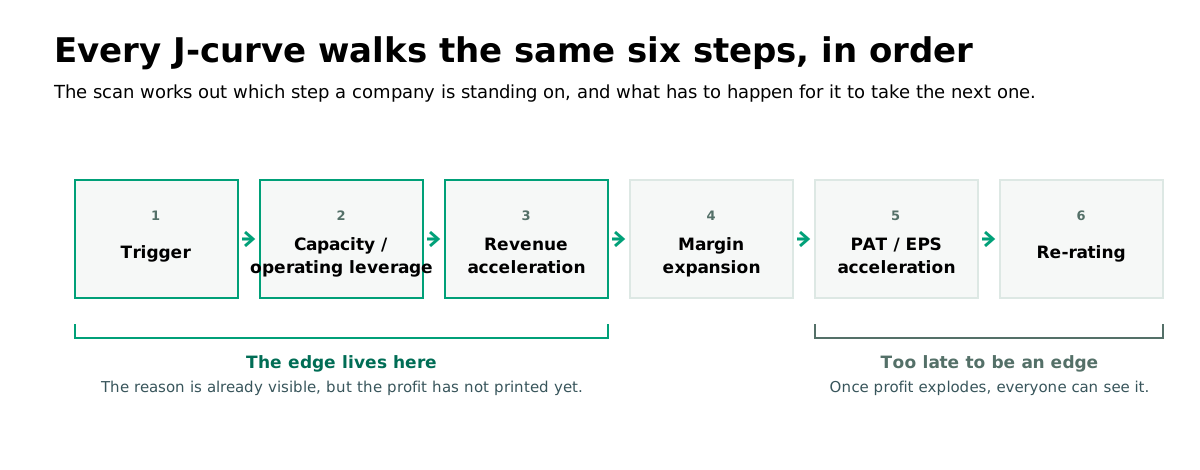
1. Trigger. Something changes. This is the starting gun. A plant is announced, a customer is won, a rule changes, a competitor shuts down, a debt gets repaid.
2. Capacity and operating leverage. The company now has more ability to produce than it is using. This is the coiled spring. A factory that can make 100 units but is making 40 has 60 units of profit waiting inside it, because the rent and the staff are already paid for.
3. Revenue acceleration. Sales start growing faster than they were growing before. Note the word faster. A company growing 15% every year forever is not accelerating. A company that went 8%, then 12%, then 19% is.
4. Margin expansion. The company starts keeping more of each rupee it sells. This usually follows step 2, because the fixed costs were already being paid.
5. Profit acceleration. Now the bottom line jumps. This is the part everybody can see.
6. Re-rating. The market notices, decides this is a better business than it thought, and agrees to pay a higher price for the same rupee of profit.
Now the important bit. By the time you reach step 5, it is too late to be an edge. When profit explodes, it is in the newspapers, it is in every screener, and everybody knows. The value of this scan is entirely in steps 1 to 3, where the reason is visible but the profit has not arrived.
That is why "profit up 200%" on its own is worth nothing to us, and why a company can be an excellent candidate with completely ordinary current numbers.
How each step is judged
The scan does not just guess which step a company is on. It marks each of the six steps with one of four labels:
| Label | What it means |
|---|---|
| Confirmed | It has actually happened, and we can point to the proof and the date |
| Underway | It is contracted or under construction, with a stated date |
| Not yet | It is the obvious next step, but nothing has happened |
| Absent | There is no reason to expect it at all |
"Confirmed" is a high bar on purpose. Money actually spent. Capacity actually commissioned. Orders actually booked. A promise is not a confirmation.
The three stages
Every company on the path is put into one of three stages. This is the single most useful thing in the scan, so read it slowly.
Stage 1: Base building. The plant is being built. The order book is filling. The debt is being repaid. But sales still look completely normal, so the market ignores the company entirely. This is not a rejection. Some of the best entries in the world live here. It is just early, and early is uncomfortable.
Stage 2: Inflection. The corner. Growth starts improving, the new capacity starts filling up, and management changes how it talks. The tell is small but reliable: they stop saying "we expect" and start saying "we are seeing".
Stage 3: Acceleration. The engine is running. Sales grow 20 to 30%, profit grows 40 to 70%, returns improve and debt falls. There is a specific fingerprint that proves this is real operating leverage rather than just a good year:
Profit growth is faster than EBITDA growth, which is faster than sales growth.
EBITDA, if you have not met the word before, is what the business earns from actually operating, before interest, tax and the accounting charge for wear and tear. It sits between sales at the top and profit at the bottom.
So that sentence just means: sales grew, the operating earnings grew faster than sales, and the final profit grew faster still. When those three line up in that order, the extra sales really are falling through to the bottom line instead of being eaten on the way down.
Now the counter-intuitive part, and the thing most people get backwards.
Stage 3 is not the best stage. Stage 2 is.
Acceleration sounds like the exciting one, and it is, but by then the move has largely happened and the price usually reflects it. A company in acceleration is only still interesting if the price has not yet caught up. Inflection is where the evidence is strong enough to trust and the price has not fully reacted. That is the sweet spot.
If a company fits none of the three, it is marked off-path and it does not appear.
The seven questions
Behind every company in this scan, seven questions get answered first. The score you see is only a summary. These questions are the actual analysis.
1. What changed? If nothing changed, there is no J-curve, however wonderful the business is. A great company that is doing exactly what it did last year is a great company, not a J-curve.
2. Is the market or sector growing? It is much easier to grow when the whole industry is growing. Swimming with the current beats swimming against it.
3. Has the company invested ahead of demand? Did it build the factory before it had the orders? This is the brave, expensive decision that creates the flat part of the J. It is also the thing that makes the steep part possible.
4. When does the new capacity actually start contributing? Not "soon". A quarter. A month. A date. This question is what turns a nice story into something you can check.
5. Can revenue grow more than 20% for two to three years? One good year is not a J-curve. The shape needs a run of them.
6. Can margins improve at the same time? Growing sales while margins shrink is just buying revenue. The J needs both moving the right way together.
7. Is the price still leaving room? If everything above is true but the market already worked it out and priced it in, the opportunity has passed. This question is asked honestly, and the answer is reported as an observation. The scan never tells you to buy or sell anything.
Fake J-curves, and how they get caught
Because a big profit jump is exciting, it is worth being suspicious of one. Before any earnings jump is believed, the scan checks where it actually came from:
- A terrible base, so this year looks huge only because last year was awful
- An inventory gain
- Exceptional or one-off income
- A currency gain
- A tax reversal
- A single one-off order that will not repeat
- Other income, which means money not made from the actual business
- A temporary commodity price benefit
The test is simple: if you strip the one-off out, is the core business still accelerating? If the answer is no, the check is marked unclean and the company does not make the list.
The reverse is also true and matters just as much. A company can be firmly on the path while printing an ugly quarter. A real factory ramp underneath a messy result is completely normal. The scan separates the two rather than reacting to the headline number.
The nine-point scorecard
Each company is scored out of nine. One point each, no half points, and a point is only given when something specific can be pointed at.
| # | Point | What earns it |
|---|---|---|
| 1 | Sector tailwind | The whole industry is growing |
| 2 | Revenue acceleration | The growth rate is improving, not just positive |
| 3 | Demand visibility | An order book or contracts covering future sales |
| 4 | New capacity or customer | A real, dated new plant, product, customer or market |
| 5 | Utilisation rising | The capacity that already exists is filling up |
| 6 | Margin expansion potential | A stated, structural reason margins can rise |
| 7 | Debt and interest falling | The borrowing and the interest bill are coming down |
| 8 | ROCE improving | Returns on the money invested are getting better |
| 9 | Guidance upgrades | Management is raising its own targets |
The total puts the company into a band:
| Score | Band |
|---|---|
| 0 to 3 | Story |
| 4 to 6 | Emerging inflection |
| 7 to 8 | Strong candidate |
| 9 | Exceptional setup |