Basics: The Four Stages
InvestorStack is built on a framework that divides a stock's long life into four stages. It comes from Stan Weinstein, who wrote about it in his book "Secrets for Profiting in Bull and Bear Markets". Once you see the four stages, a lot of the technical scanners start to make obvious sense.
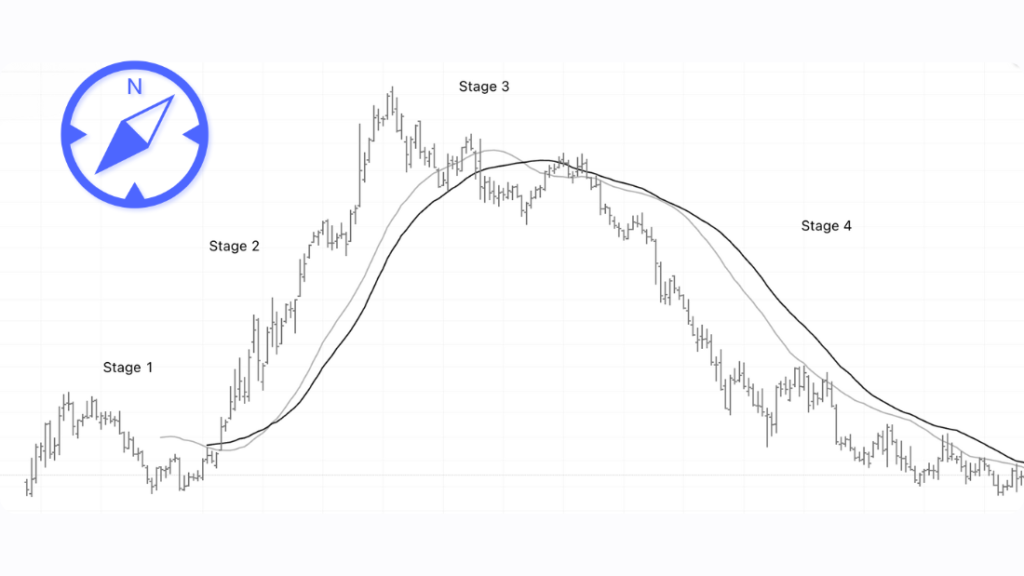
The one idea
A stock does not trend up forever and it does not fall forever. It moves through a repeating cycle: it goes down, it stops going down, it goes up, and then it starts going down again. Weinstein gave each of those four phases a number.
The trick is that money is not made evenly across the cycle. It is made in one specific stage. The scanners are largely trying to catch stocks entering that stage, or already living in it.
The cycle, in plain words
Close your eyes and picture the full life of a stock in four phases.
Stage 1: The base. After a long fall, the stock stops making new lows. It starts trading sideways, carving out a flat area on the chart. Nothing is happening yet. This is the accumulation zone, where smart money quietly builds positions. The 30-week moving average flattens out.
Stage 2: The uptrend. The stock breaks out of the sideways range and starts making higher highs and higher lows. The 30-week moving average turns up and the price rides above it. This is where most of the money is made. This is the stage everybody wants to be in.
Stage 3: The top. The stock stops making meaningful new highs. Higher highs stop, the price starts churning near the highs, and the trend loses energy. The moving average flattens again. This is distribution happening above you.
Stage 4: The decline. The stock breaks below its support and starts making lower highs and lower lows. The trend is down. Money leaves. The move to avoid.
The stock then loops back into Stage 1 and the cycle repeats.
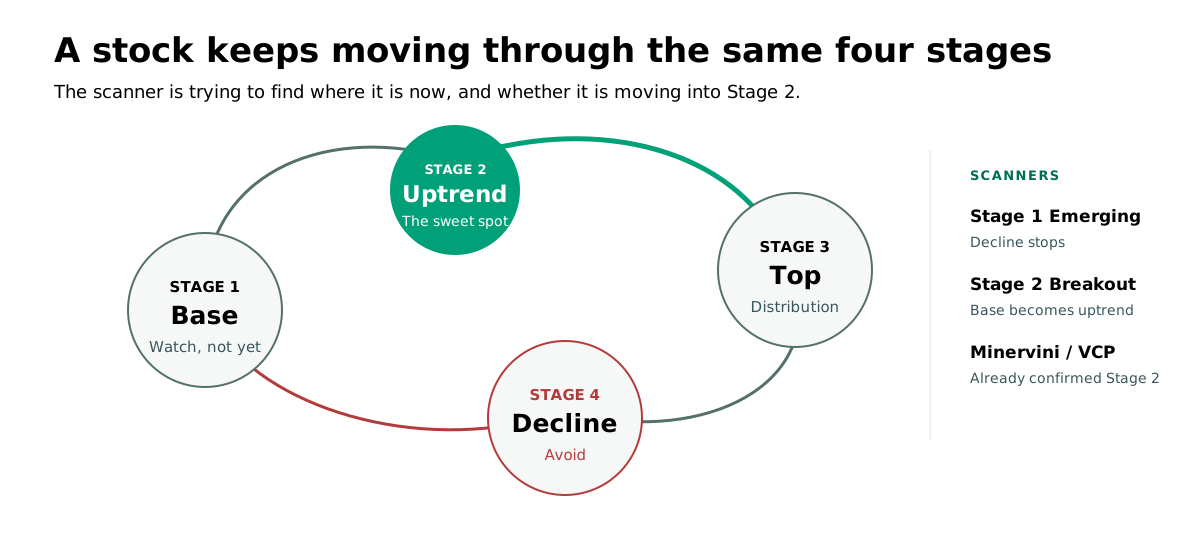
The four stages at a glance
| Stage | What is happening | Is it a place to buy? |
|---|---|---|
| 1 | Base, sideways, accumulation | Not yet, but watch it |
| 2 | Uptrend, higher highs and lows | Yes, the sweet spot |
| 3 | Top, churning near highs | No, be careful |
| 4 | Decline, lower highs and lows | No, avoid |
Why the stages matter to scanners
Almost every technical scanner in InvestorStack is built around this framework, whether it says so or not.
- Stage 2 Breakout catches the exact moment a stock moves from Stage 1 into Stage 2. That is the transition into the money-making stage, on above-average volume.
- Stage 1 Emerging catches the earlier moment a stock moves from Stage 4 down into Stage 1, meaning the decline has stopped and a base is starting to form.
- The trend-template scanners (Minervini and VCP) only fire on stocks already in a confirmed Stage 2 uptrend. They are Stage 2 filters.
So the stage framework is the backbone. When a scanner talks about a "Stage 2 leader", it means a stock in the strongest part of its cycle.
How to see a stock's stage
On any company page in InvestorStack, there is a stage tracker. It shows which of the four stages the stock is in right now, and how long it has been there. That single bit of context tells you a lot before you do anything else. A stock in Stage 2 with a high RS rating is a name worth a look. A stock in Stage 4 is a stock in decline, whatever its last week looked like.
How the stage is measured
The stage is computed from the stock's own price history, primarily its relationship to its longer-term moving averages and its series of highs and lows. A simple way to think about it:
- In Stage 2, the stock has made higher highs and higher lows, and it sits on or above its rising long-term (30-week) average.
- In Stage 4, it has made lower highs and lower lows when measured the same way.
The exact signal uses the price action against the long average, the direction of that average, and whether recent highs and lows are climbing or falling. The scanners apply this mechanically so the stage is consistent across all 1,850 companies.
What the 30-week average is
You will see "30-week average" or "30-week moving average" in the stage scans. It is the average closing price over the last 30 weeks, roughly 150 trading days. It is the long trend line each stage is measured against. When the price is above a rising 30-week average, the trend is your friend. When it is below a falling one, you are fighting the trend.
The Stage 1 Emerging scan uses a related detail: it only fires when the stock is within about 2% of its 30-week average. That confirms the stock is settling into its base and hugging the long trend, rather than a falling knife.
How to put the stages to work
The stage framework gives you discipline. Once you know a stock is in Stage 2, the rule is to let it trend and hold it while it does. If it loses the uptrend and drops back into Stage 1, or worse into Stage 4, you have a clear exit signal. The scan is not just a list. It is an entry point into a structured way of holding a position.
Most of the money is made in Stage 2. The scanners exist to put you there. That is the whole point of the stage framework.
Next steps
Now you know the two core lenses. Relative strength tells you which stocks are beating the market. The stage framework tells you where each stock sits in its own long cycle. The technical scanners combine these two lenses in different ways.