Basics: What a Technical Scan Is
This is the mental model behind all sixteen technical scanners. Read this once and every technical scanner chapter becomes easier to follow, because sixteen scanners are really a handful of simple building blocks combined in different ways.
In one idea
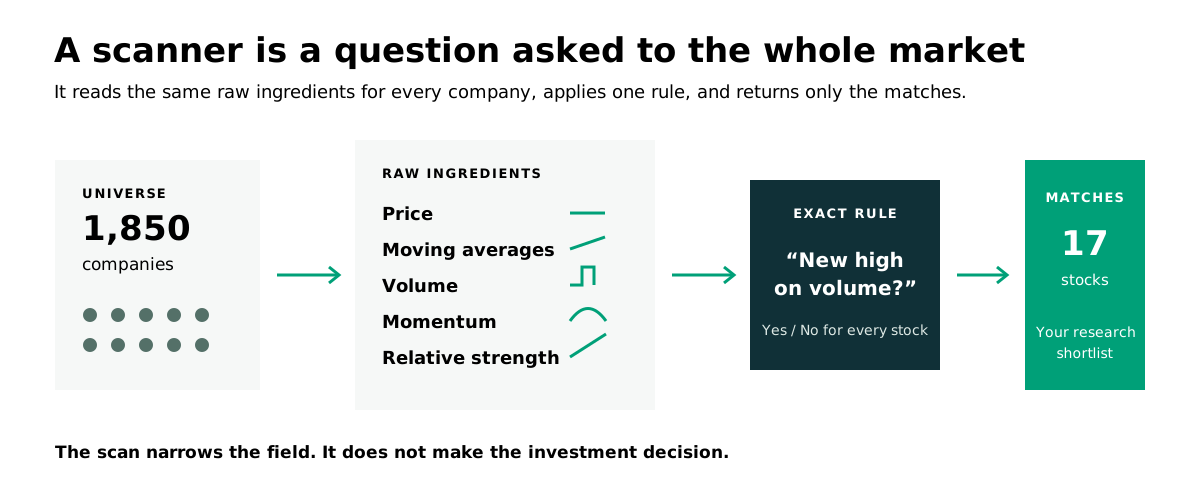
A technical scanner reads price and volume, then applies a rule, then shows you the companies that match. It does not read the company's accounts, its management, or its industry. It reads the tape. What is the market doing with this stock?
The question matters because the market prices in a lot before the numbers catch up. If a stock is steadily being bought more than it is being sold, the chart shows it before the story is obvious.
The building blocks
Every technical scanner is built from a small set of raw ingredients. Learn these five and you can read any technical scan.
1. Price
The closing price, and how it connects over time. Scanners compare today's close to past closes. A "new high" scan only cares about price. A "breakout" scan cares about price crossing a level.
2. Moving averages
A moving average smooths price over a window so you can see the trend without the daily noise. Two kinds show up all over this manual:
Simple Moving Average (SMA). The average closing price over the last N days. The 50-day, 150-day, and 200-day SMAs show the medium to long trend. The 200-day is a common line between "trend up" and "trend down".
Exponential Moving Average (EMA). Like an SMA, but it weights recent days more heavily, so it reacts faster. The 8-day and 21-day EMAs catch short-term turns. As a rough feel, a 10-day EMA puts roughly 18% of its weight on the most recent day, which is why it turns before a simple average does.
When one moving average crosses another, it is a signal. The Golden Cross (50 over 200) is a long-term signal. The EMA 8/21 Cross is a short-term one.
3. Volume
Volume is how many shares traded. It is the fuel behind a move.
A move on big volume means conviction. A breakout on above-average volume means real buying, not a low-volume fluke. Many scanners require above-average volume to confirm a signal. InvestorStack uses relative volume (RVOL), which compares today's volume to its own recent average, and a 20 day average volume figure.
4. Momentum
Momentum is how fast and how far a stock has moved over a window. Some scans measure it directly with an indicator like RSI. Others measure it through relative strength. Momentum scans want stocks that are moving and, usually, moving in the right direction.
5. Relative strength rating
The rank against the universe you met in the relative strength chapter. Several technical scanners use it as a filter, to make sure a chart signal is happening in a stock that is also beating the market.
Two kinds of technical signal
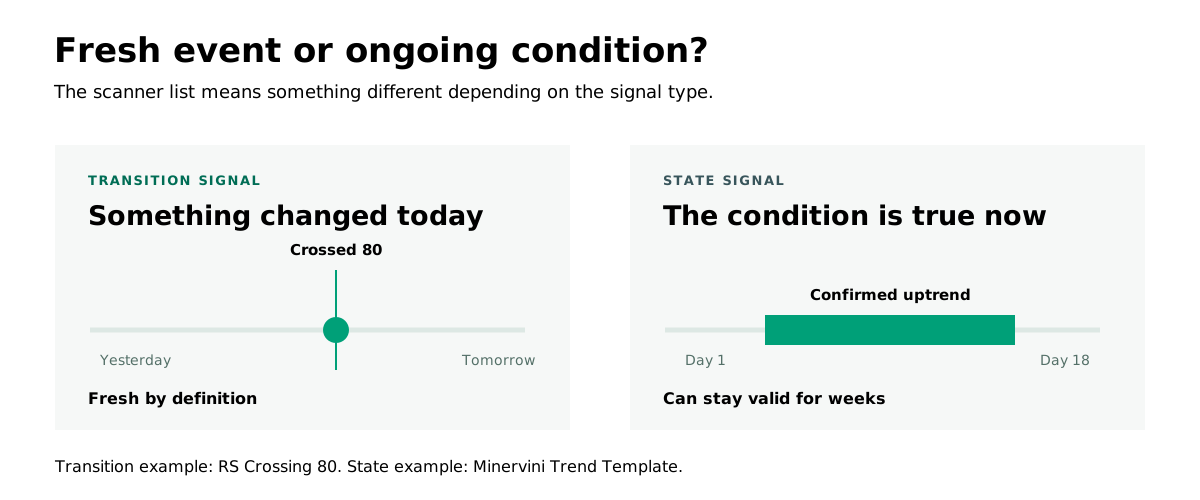
Technical scanners mostly produce one of two kinds of output:
Transition signals. A stock did a specific thing today that it was not doing yesterday. It crossed a moving average. It moved from one stage to another. Its RS rating crossed a threshold. These are events, and they are fresh by definition.
State signals. A stock is currently in a certain condition, like "in a confirmed uptrend" or "consolidating near a high." These are conditions that can persist for weeks. The Minervini Trend Template is a state scan. It fires on stocks that stay in the right condition, not on a single day's change.
It helps to know which kind you are looking at, because a state signal means the stock may not be new to the list. It may have qualified days ago and be just as valid now.
Freshness and history
Every technical scanner shows today's matches and the trigger history for the last 7 and 30 days. Use it to judge freshness.
A transition that just fired today is at the start of its move. A name that fired three weeks ago may already be extended, price well above where the signal happened. The list tells you, and the history tells you, whether you are early or late to the idea.
The intuition that ties it together
Think of a technical scan as a question you ask of the whole market at once:
- "Which stocks broke out of a base on volume today?" That is Stage 2 Breakout.
- "Which stocks closed at their highest price in a year?" That is New 52-Week Highs.
- "Which stocks are both strongly outperforming the market and in a clean uptrend?" That is the Minervini family.
The limits worth knowing
A technical scanner shows what the market is doing with a stock today. It does not tell you if the company is any good, and it does not tell you what the stock is worth. That is where fundamental scanners and the research layers (investorstack 😁) come in.
The strongest setups combine the two. A technical scan says the market is moving the stock. A fundamental scan says the company is growing. Together they are a much stronger idea than either alone.
Where the building blocks recur
Each technical scanner chapter in this manual names its exact rule and its thresholds, straight from how InvestorStack computes it, so you can read precisely what qualified a stock. A few use only one building block, like New 52-Week Highs. The richer ones, like Minervini and Darvas, stack several together.
Pick one scanner you are curious about and read its chapter. The other chapters follow the same shape, so once you can read one, you can read them all.