Golden Cross
Golden Cross is one of the most famous technical signals in trading. It happens when a stock's 50-day moving average crosses above its 200-day moving average. That single event marks a shift in the long-term trend from down to up. InvestorStack's version adds a time window and a price filter.
First, what the moving averages are
Two simple moving averages (SMAs) drive this signal:
- The 50-day SMA, which shows the medium-term trend, about ten weeks.
- The 200-day SMA, which shows the long-term trend, about a year of trading.
You met SMAs in the basics chapter. Each is just the average closing price over its window. The 200-day is a widely used dividing line between "the long trend is up" and "the long trend is down".
What a golden cross is
A golden cross is the event where the 50-day SMA moves above the 200-day SMA. When the medium-term average overtakes the long-term one, it signals that the recent trend has turned decisively up relative to the long term.
The name comes from the idea that a long-term trend reversal up is about as good as a signal gets. The opposite event, the 50-day crossing below the 200-day, is called a death cross, and it signals a long-term downtrend.
The honest caveat
Moving-average crossovers are trend-following, and trend-following signals struggle in sideways markets. When the market has no clear direction, moving averages cross back and forth and produce false leads. The golden cross is strongest when the stock is genuinely in a fresh long-term advance, which is exactly why the scanner also demands the price sit above both averages.
Crossovers also lag. They only confirm a trend after it has been running, because an average cannot turn until price has moved far enough. That is the trade-off: you give up some of the start of the move for a confirmed, more reliable signal.
The exact rule
A stock qualifies when:
- Its 50-day SMA is now above its 200-day SMA.
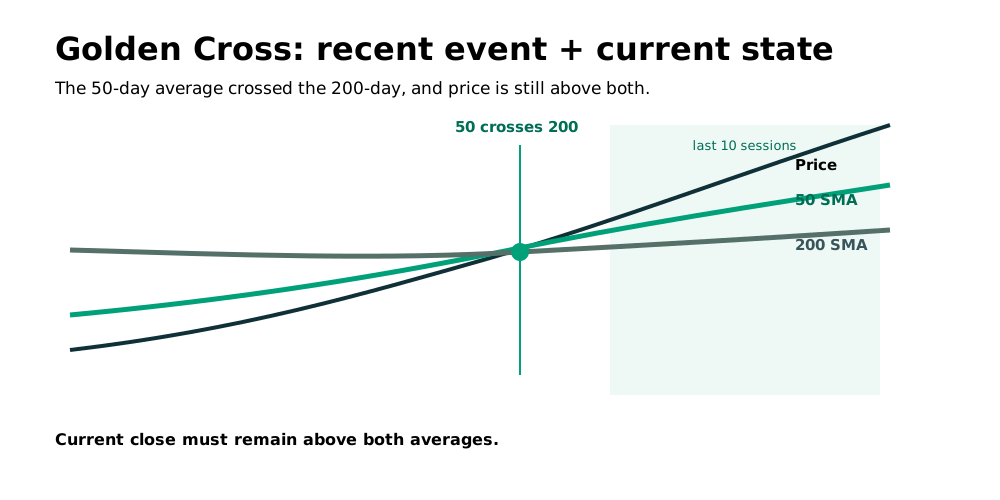
- About 10 days ago, its 50-day SMA was still below its 200-day SMA. So a cross happened sometime in that window.
- Its closing price is above both the 50-day and 200-day SMAs.
The last filter matters. It is not enough for the averages to cross. The stock has to be trading above both averages, confirming that price agrees with the new uptrend.
The 10-day window
The scan does not demand the cross happen exactly today. It looks back about 10 trading sessions and accepts a golden cross that occurred within that window. The stock is then still above both averages.
This is a state-plus-event scan. The event is the recent cross. The state is that the stock currently sits above both long averages. Both have to be true.
Why it matters
A golden cross is a long-term trend confirmation. It tells you the medium-term price action has pulled the stock into a position where its recent trend is clearly up.
Golden crosses are slow and reliable more than fast. They lag the actual turn, because moving averages only confirm a trend after it has been running for a while. But the reliability is the point. When a long-term trend flips up, it tends to persist. Catching that flip is the value.
A stock that golden-crossed in the last couple of weeks and keeps rising is in a fresh long-term uptrend.
Reading it in context
A golden cross is a strong signal, but it is still just one lens:
- A golden cross on a stock in a Stage 2 uptrend aligns the long trend and the stage. Strong.
- A golden cross on a stock with improving relative strength is a solid confirmation of leadership.
- Pair it with the business. A long-term uptrend backed by a company actually growing is the ideal combination.
Once a golden cross has printed, the price level where the two averages crossed becomes a reference the market watches. On a pullback, that level can hold as support. Because the 50 and 200-day averages are so widely followed, the cross carries a self-reinforcing quality: enough traders watch it that their collective attention makes the level matter. It is not magic, but it is part of why the signal is so famous.
The gap between short and long
Golden Cross is the long-term moving-average scanner. Its sibling, EMA 8/21 Cross, is the short-term one.
- Golden Cross: 50 over 200, slow, long-term, reliable.
- EMA 8/21 Cross: 8 over 21, fast, short-term, early.
A stock showing both is aligned across the full trend spectrum. That alignment is a strong sign.