Basics: Relative Strength
Relative strength is the single most useful idea in this manual, and it is behind several of the technical scanners you will meet. Before you touch any scanner, spend five minutes here. Everything else builds on it.
The core idea
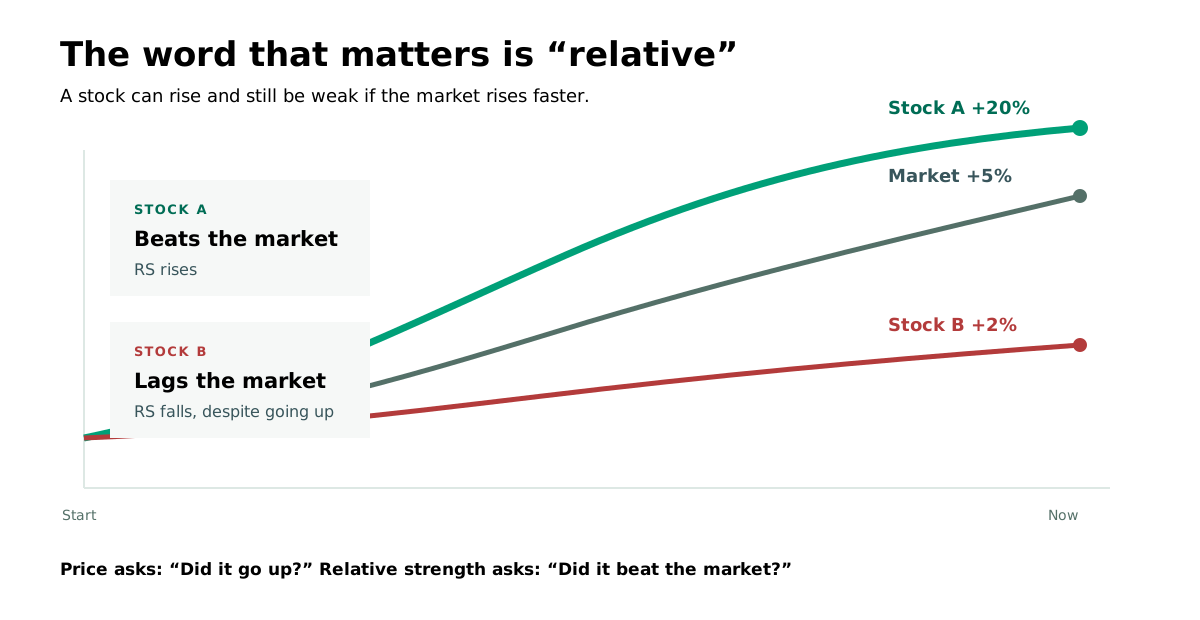
Two stocks can both be going up. One goes up more than the other. That difference, measured against the rest of the market, is relative strength.
The name gets people confused, because the word "relative" is doing the work. Relative strength is not "is this stock strong." It is "is this stock stronger than the market around it."
A simple way to hold it: divide one stock by a benchmark and watch how that ratio moves over time. When the ratio is rising, the stock is beating the benchmark. When it is falling, the stock is lagging.
Why it matters
In a market where most stocks drift up and down together, the difference in how far each one moves is where the signal lives.
A stock that is stronger than the market tends to stay stronger for a while. Money flows to the leaders. Institutions keep buying names that keep outperforming. This is why trend followers put so much weight on relative strength. They want to be in the names that are already leading, not the ones hoping to catch up.
The reverse also matters. A stock that holds up well while the market falls is often the leader that leads when the market turns back up. Relative strength during a decline is a buy signal, not a reason to run.
How InvestorStack measures it
InvestorStack computes a relative strength rating for every company. It is a number, typically 1 to 99, that ranks a stock against the whole universe over a recent window.
The intuition behind the number: it compares the stock's recent performance with the market's recent performance and compresses that comparison into a single score. A high rating means the stock is outperforming most of the universe. A low rating means it is lagging most of it.
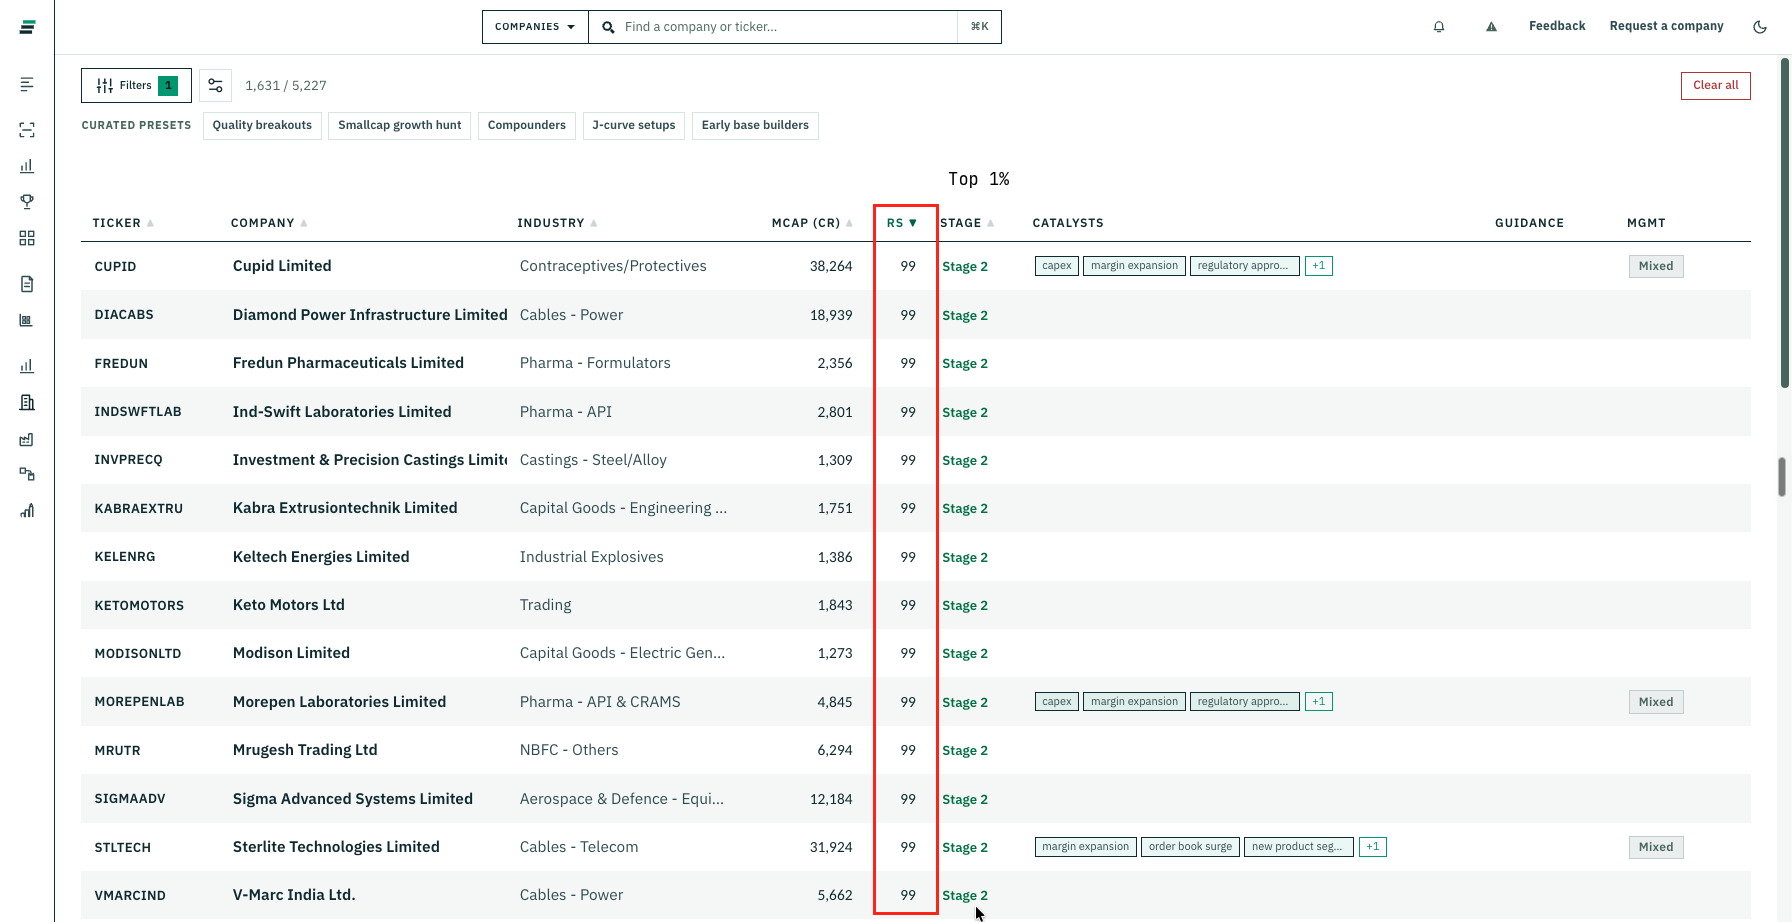
Because it is a rank, not a price, you can compare one stock's rating to another's no matter what their prices are. That is what makes it useful in a list of thousands of companies.
A rating above 70 means the stock sits in roughly the top 30% of the universe by strength. A rating of 80 or more is the top roughly 20%. Crossing above 80 is a meaningful event in several of our scanners, which is why RS Crossing 80 has its own chapter.
Relative strength versus the RSI
Two easily confused things:
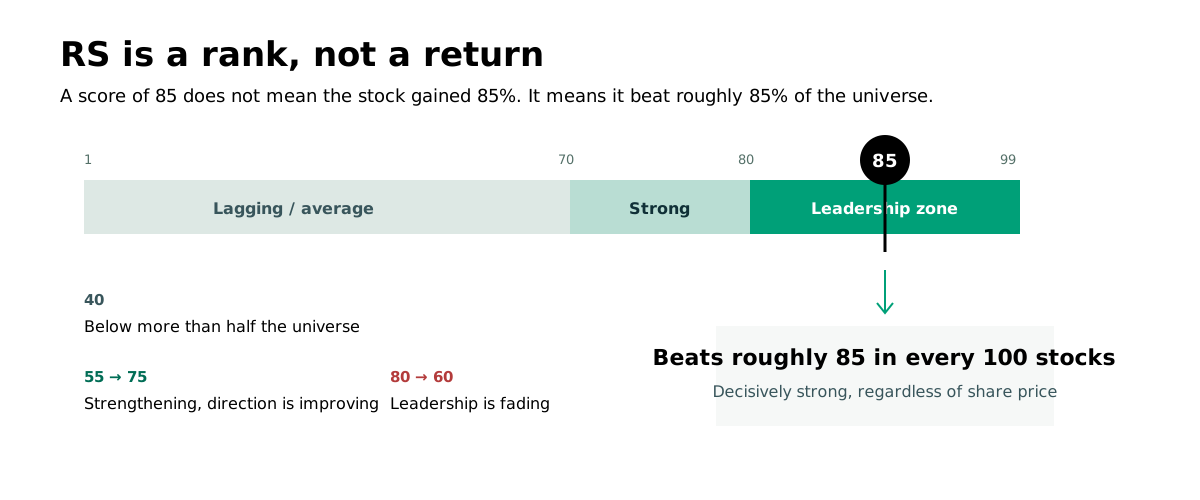
Relative strength (RS) is what this page is about. It ranks a stock against the market. It lives in the high numbers like 70 and 80.
The Relative Strength Index (RSI) is a different thing entirely, despite a similar name. RSI is a momentum oscillator, a number between 0 and 100, built from a stock's own up days versus its own down days. It has nothing to do with the market. The RSI Breakout scanner uses it, and its chapter explains it.
Do not mix the two up. Whenever you see "RS rating" in InvestorStack, it means relative strength against the market. Whenever you see "RSI", it means the momentum oscillator.
How to read a relative strength rating
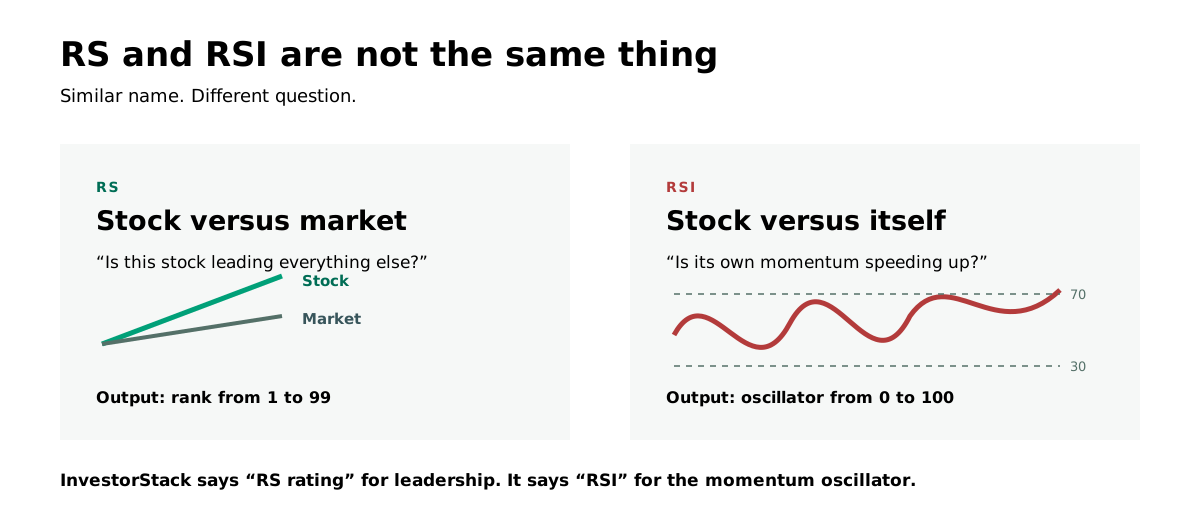
Think of the RS rating as a rank-out-of-the-universe, on a scale that roughly runs 1 to 99.
- A stock at 85 is outperforming roughly 85% of the universe. It is decisively strong.
- A stock at 40 is underperforming more than half the universe. It is weak on a relative basis, even if its own price is not falling.
- The number is a snapshot. What matters more is the direction. A rating climbing from 55 to 75 is strengthening. A rating falling from 80 to 60 is losing its leadership.
This is why RS-driven scans care about changes and crossings, not just levels. RS Crossing 80 catches the moment strength steps up a gear. RS 30-Day High catches the moment strength reaches a new peak.
The direction is the signal
A rising RS rating says a stock is steadily beating the market. That is the kind of consistent outperformance institutions buy into. A falling RS rating says leadership is fading, and one of the trend scanners will often drop that stock or refuse to fire on it.
When you combine a strong RS rating with a stock in a confirmed uptrend, you get a powerful combination. It is exactly what the Minervini scans and the Stage 2 scans are trying to assemble for you.
A quick example
Picture two stocks in the same week. The market rises 1%. Stock A rises 3%. Stock B rises 0.5%. Both went up. But A gained on the market and B lost ground to it. On a relative strength basis, A is strong and B is weak. The RS rating between them diverges over time. InvestorStack's rating system is built to surface exactly that difference.
Where the RS rating appears
You will see the RS rating on company pages, inside scanner results, and as part of the mashup that powers several technical scans. When a scanner result shows an RS rating, that is the number it is describing. The higher it is, and the more it is climbing, the more firmly the stock is in the leadership zone.
Next steps
Relative strength is one building block. The other is the stage framework, which describes where a stock sits in its own long trend. Put them together and you have the two core lenses behind most of the technical scanners.